Reporting period: November 2–9, 2026
Diesel prices fell sharply across the United States this week, while DAT Freight & Analytics reported a significant increase in refrigerated freight demand and tighter capacity conditions in the spot market.
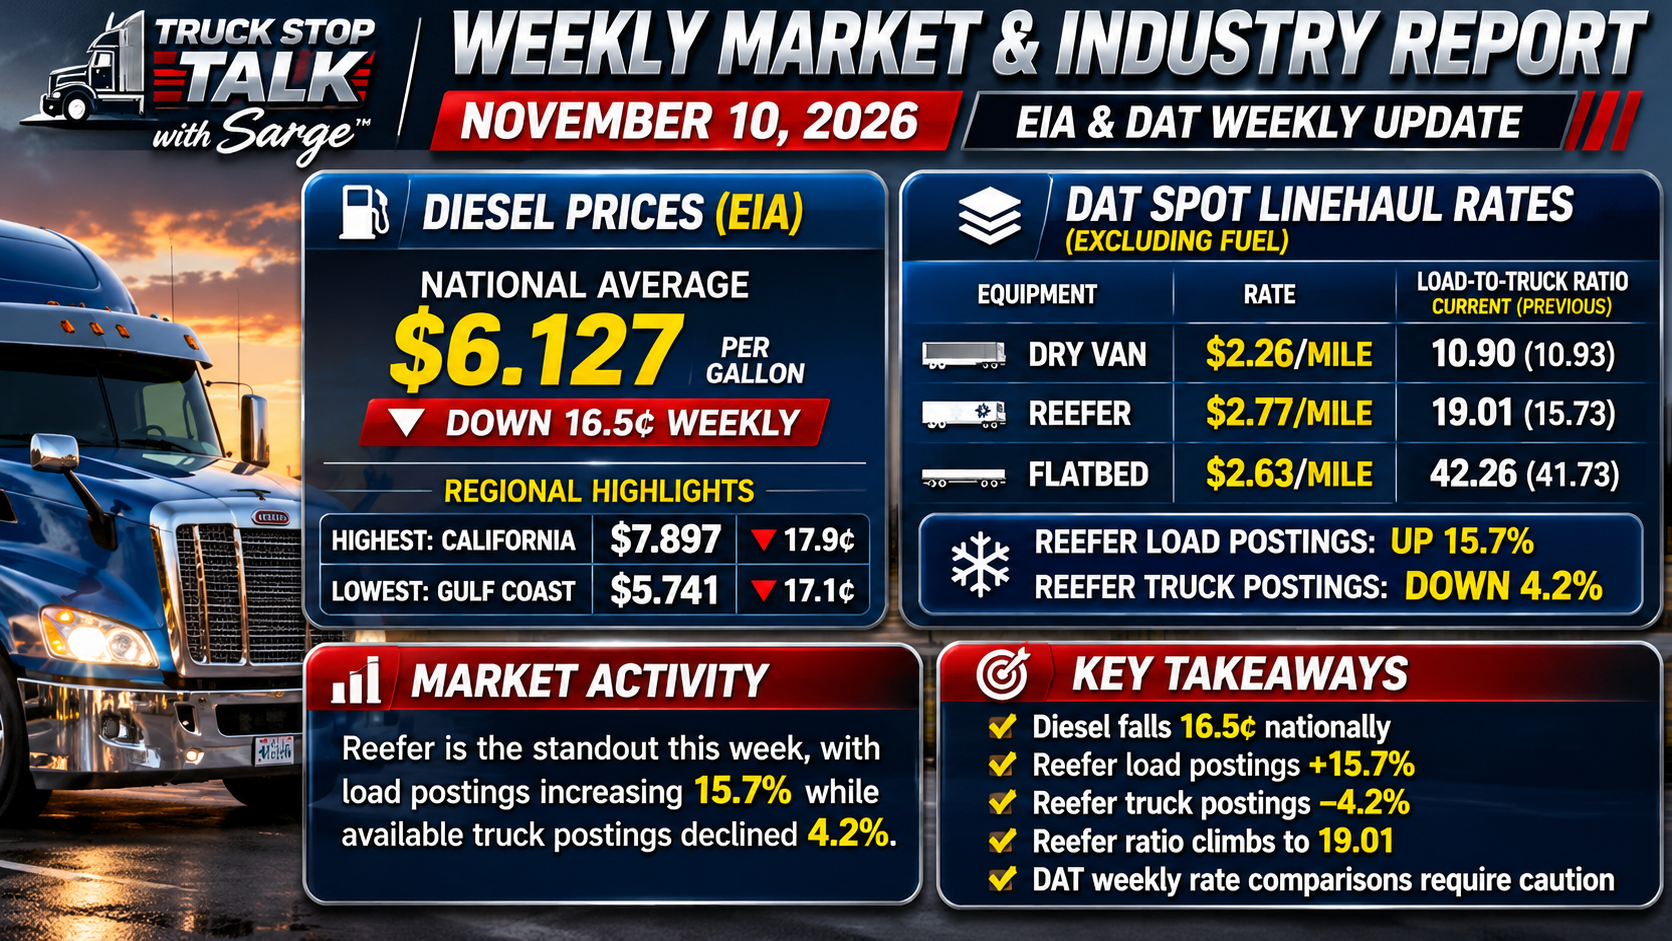
According to the latest U.S. Energy Information Administration (EIA) figures, the national average price of on-highway diesel declined 16.5 cents to $6.127 per gallon.
Meanwhile, DAT's November 9 reports showed national spot linehaul averages of $2.26 per mile for dry van, $2.77 for reefer, and $2.63 for flatbed, excluding fuel surcharges.
Refrigerated freight produced the week's most notable market movement, with load postings increasing 15.7% while available truck postings declined 4.2%.
Together, these developments present a mixed but potentially encouraging picture for trucking operations: lower fuel expenses and tighter freight capacity, particularly in refrigerated transportation.
Diesel Prices Fall for the Second Consecutive Week
The EIA's November 10 release shows the national average diesel price declining from $6.292 to $6.127 per gallon.
That represents a weekly decrease of 16.5 cents, following the previous week's 6-cent decline.
Combined, the national average has fallen 22.5 cents per gallon over two weeks.
Every major region tracked by EIA reported lower diesel prices this week.
Regional Diesel Prices
United States: $6.127 per gallon | Down 16.5 cents
East Coast: $5.920 | Down 10.5 cents
New England: $6.349 | Down 6.7 cents
Central Atlantic: $6.412 | Down 7.4 cents
Lower Atlantic: $5.694 | Down 12.0 cents
Midwest: $6.201 | Down 20.1 cents
Gulf Coast: $5.741 | Down 17.1 cents
Rocky Mountain: $6.206 | Down 23.9 cents
West Coast: $7.110 | Down 16.2 cents
West Coast excluding California: $6.429 | Down 14.6 cents
California: $7.897 | Down 17.9 cents
Source: EIA Weekly On-Highway Diesel Prices. Reporting week November 9, 2026. Prices include taxes.
The Rocky Mountain region experienced the largest weekly decline among EIA's major regions, falling 23.9 cents per gallon.
The Midwest followed with a 20.1-cent decrease.
California remained the most expensive area reported, averaging $7.897 per gallon despite a 17.9-cent decline.
The Gulf Coast continued to report the lowest average among the major regions at $5.741.
The difference between California and the Gulf Coast remained more than $2.15 per gallon.
That regional price difference continues to matter for trucking operations purchasing fuel across multiple states.
What Lower Diesel Prices Mean for Trucking Operations
Fuel is one of the largest operating expenses in commercial trucking.
A 16.5-cent weekly decline can make a measurable difference, particularly for operations purchasing large volumes of diesel.
At the new national average of $6.127 per gallon:
150 gallons: Approximately $919.05.
Last week's cost for 150 gallons: $943.80.
Weekly difference: $24.75 less per 150-gallon purchase.
1,000 gallons: Approximately $165 less than last week.
Over the past two weeks, the national average has declined 22.5 cents per gallon.
For an operation purchasing 1,000 gallons, that represents a $225 difference compared with the October 26 national average, assuming its fuel purchases track EIA's national figures.
Actual savings depend on where fuel is purchased, discounts, fuel consumption, and purchasing arrangements.
Lower diesel prices do not automatically translate into equivalent increases in carrier profitability, particularly when fuel surcharge arrangements adjust alongside market prices.
Nevertheless, the latest decline provides some relief from the elevated fuel costs reported throughout October.
DAT Freight Market: Reefer Leads the Week
DAT Freight & Analytics released its latest equipment-specific market reports on November 9.
The reports show the following national spot linehaul averages:
Dry van: $2.26 per mile
Reefer: $2.77 per mile
Flatbed: $2.63 per mile
These are linehaul-only figures and exclude fuel surcharges.
DAT's latest reports describe increases in national spot rates. However, the published week-over-week changes do not consistently reconcile with the national averages reported in the preceding weekly reports.
Truck Stop Talk is therefore presenting the current published rate figures while avoiding unsupported conclusions about the precise weekly changes.
The load-to-truck ratios provide a clearer picture of how posted freight demand and available capacity shifted during the week.
Dry Van: Load-to-Truck Ratio Holds Near Last Week's Level
DAT reported a national dry van spot linehaul average of $2.26 per mile.
The dry van load-to-truck ratio was 10.90, compared with 10.93 the previous week.
That represents a slight decline in the ratio, indicating that the overall balance of posted loads to available trucks remained relatively stable.
Dry Van Market Snapshot
Current spot linehaul rate: $2.26 per mile
Previous load-to-truck ratio: 10.93
Current load-to-truck ratio: 10.90
The national ratio suggests that dry van market conditions changed relatively little compared with the previous reporting week.
Individual freight lanes may still experience significant differences in available loads, truck capacity, and negotiated rates.
National averages provide useful context but do not necessarily reflect the conditions facing a carrier in a particular market.
Reefer: Freight Demand Increases Sharply
Refrigerated freight was the standout category in DAT's latest report.
The national reefer spot linehaul average reached $2.77 per mile, excluding fuel.
More importantly, DAT reported a substantial increase in load postings accompanied by a reduction in available truck postings.
Reefer Market Snapshot
Current spot linehaul rate: $2.77 per mile
Load postings: Increased 15.7%
Truck postings: Declined 4.2%
Previous load-to-truck ratio: 15.73
Current load-to-truck ratio: 19.01
The load-to-truck ratio increased from 15.73 to 19.01, approximately a 20.9% increase.
That represents a meaningful tightening in refrigerated freight capacity.
DAT also reported that refrigerated load postings were 21.6% above the same period last year.
Holiday Freight Begins Influencing the Market
The timing is particularly important.
November brings increased movement of temperature-sensitive food products as Thanksgiving approaches.
Refrigerated transportation demand can be influenced by shipments of meat, dairy products, produce, and other perishable goods moving into distribution networks.
DAT's November 9 report specifically identifies holiday food freight as a factor contributing to the stronger refrigerated market.
The report also notes that refrigerated rates and freight availability vary significantly by origin region.
For refrigerated carriers, stronger national load-board conditions may create additional opportunities, but actual rates remain dependent on individual lanes and available equipment.
Source: DAT Reefer Report, November 9, 2026.
Flatbed: Capacity Remains Tight
Flatbed freight continued to report the highest load-to-truck ratio among the three major equipment categories.
DAT's latest national flatbed spot linehaul average was $2.63 per mile, excluding fuel.
Flatbed Market Snapshot
Current spot linehaul rate: $2.63 per mile
Previous load-to-truck ratio: 41.73
Current load-to-truck ratio: 42.26
The ratio increased modestly from the previous week, indicating continued tightness in posted flatbed capacity.
However, the higher ratio should not be interpreted as proof that flatbed carriers earn more than dry van or refrigerated carriers.
Flatbed transportation involves different operating expenses, equipment requirements, cargo securement responsibilities, and freight characteristics.
The ratio measures posted loads relative to available trucks within DAT's marketplace, not overall carrier profitability.
Comparing the Three Freight Markets
The latest DAT load-to-truck ratios show different conditions across the major equipment categories.
Dry Van
Previous week: 10.93
Current week: 10.90
Market movement: Relatively stable
Reefer
Previous week: 15.73
Current week: 19.01
Market movement: Significant tightening
Flatbed
Previous week: 41.73
Current week: 42.26
Market movement: Modest tightening
Refrigerated freight recorded the most significant change.
Flatbed maintained the highest ratio, while dry van remained close to its previous level.
These figures represent activity on DAT's load board and should not be treated as measurements of total nationwide freight volume or the entire operating truck population.
A Note About DAT's Weekly Rate Comparisons
Truck Stop Talk identified discrepancies in DAT's published weekly national spot linehaul comparisons during the previous reporting cycle.
The issue remains relevant this week.
For example, DAT's November 2 reefer report listed a national spot linehaul average of $2.71 per mile.
The November 9 report lists $2.77 per mile, a difference of 6 cents.
However, DAT's November 9 report describes an increase of 9 cents.
Similar inconsistencies appear in other equipment-specific weekly comparisons.
These differences may involve underlying reporting methods, revisions, or comparison periods, but the available publications do not establish a definitive explanation.
Accordingly, Truck Stop Talk is reporting the current published averages and independently identifiable load-to-truck changes without presenting DAT's conflicting weekly rate-change figures as reconciled facts.
What This Week's Numbers Mean for Drivers and Carriers
Two developments stand out.
First, diesel prices have declined substantially over the past two weeks.
The national average has fallen 22.5 cents per gallon since October 26.
For carriers purchasing large quantities of fuel, that represents a meaningful reduction in average fuel expense.
Second, refrigerated freight demand has strengthened entering the holiday shipping period.
The increase in reefer load postings, combined with fewer available truck postings, has produced a noticeably tighter market.
Dry van conditions remained comparatively stable, while flatbed capacity continued to show modest tightening.
But these developments do not guarantee stronger earnings across the trucking industry.
Carrier profitability still depends on negotiated freight rates, fuel consumption, deadhead miles, equipment expenses, maintenance, insurance, and other operating costs.
Market Outlook
The coming weeks will help determine whether refrigerated freight demand continues strengthening as Thanksgiving approaches.
Seasonal food distribution may support additional refrigerated activity, but the magnitude and duration of that demand remain uncertain.
For dry van and flatbed carriers, changes in freight postings and truck availability will provide additional indications of market direction.
Diesel prices also warrant continued attention.
The next scheduled EIA diesel release is November 17, 2026.
Sarge's Market Takeaway
This week's numbers show two developments that matter to trucking operations.
Diesel dropped 16.5 cents nationally, following a 6-cent decline the previous week.
That's 22.5 cents per gallon in two weeks, and when you're buying diesel by the hundreds or thousands of gallons, those numbers add up.
On the freight side, refrigerated transportation is showing the strongest movement.
A 15.7% increase in reefer load postings, combined with a 4.2% decline in available trucks, pushed the load-to-truck ratio from 15.73 to 19.01.
That's a significant change in posted freight conditions.
Dry van remained relatively steady, while flatbed continued to show tight capacity.
The important distinction is that stronger load-board numbers and lower fuel prices don't automatically mean every truck is making more money.
What matters is the freight available in a particular market, the rate negotiated, and what it actually costs to move that load.
For this week, the story is clear: diesel prices are falling, and refrigerated freight demand is strengthening as the holiday shipping season approaches.
Official Data Sources
U.S. Energy Information Administration
EIA Gasoline and Diesel Fuel Update
EIA Weekly On-Highway Diesel Price History
DAT Freight & Analytics
DAT Reefer Market Report, November 9, 2026
DAT Freight Market Updates
DAT Trendlines
Reporting note: Diesel figures reflect EIA's November 9 reporting week, released November 10. DAT figures come from its November 9 market reports. All spot linehaul rates exclude fuel surcharges.