Reporting period: October 26–November 2, 2026
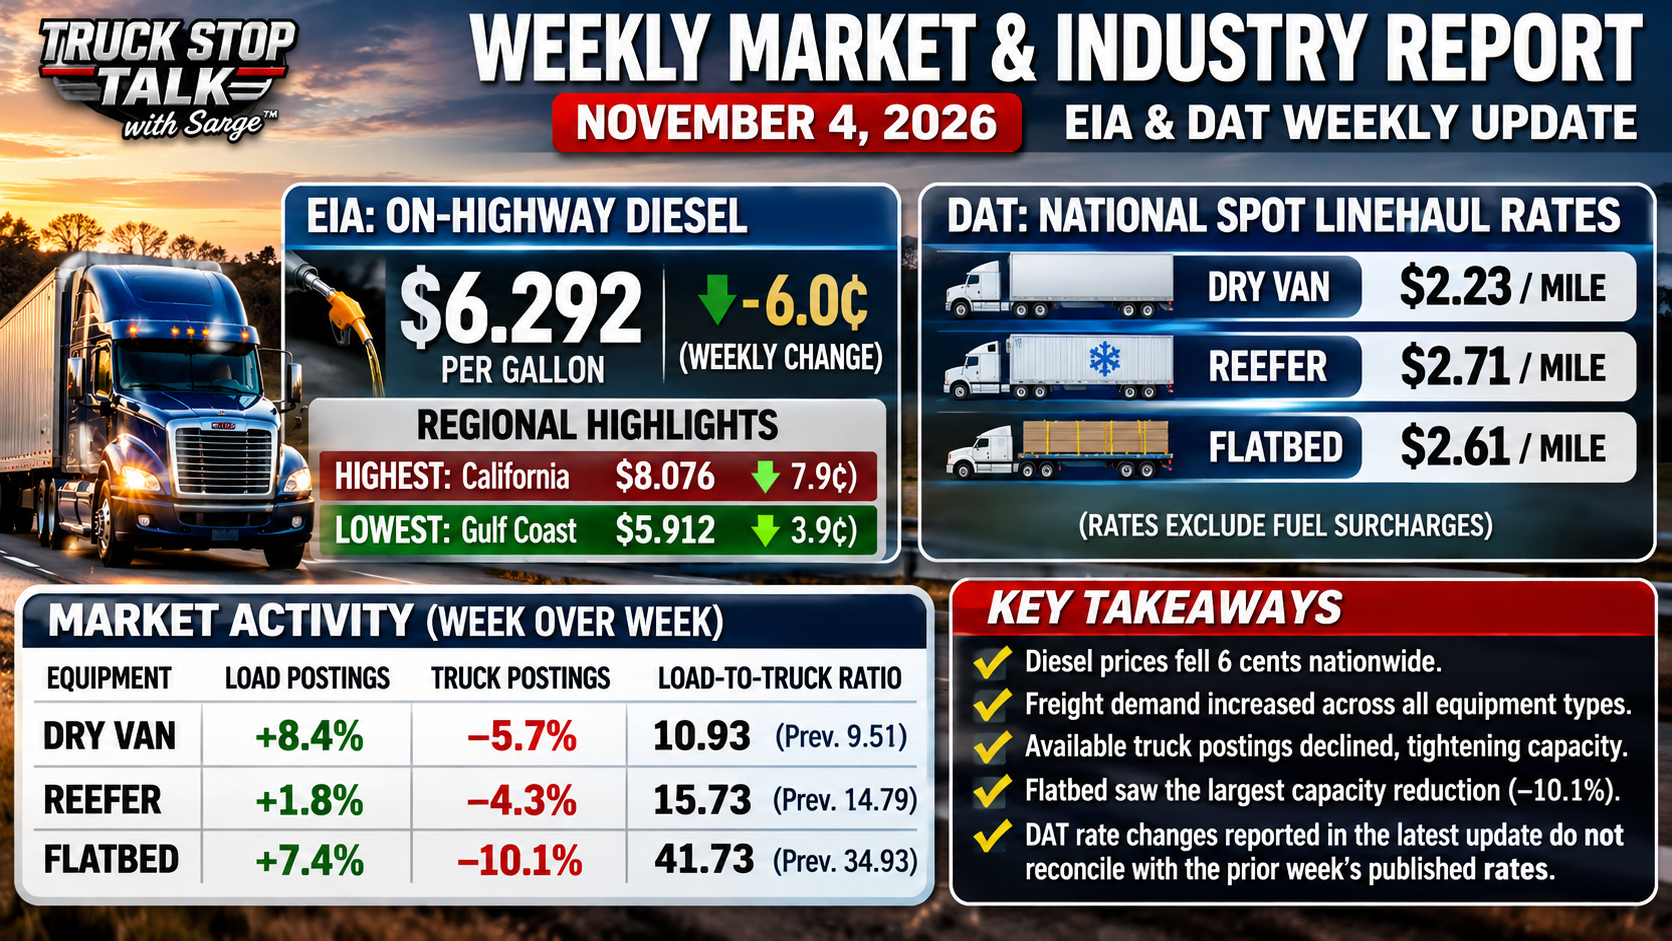
Diesel prices declined nationwide this week, while the freight spot market showed stronger load-board demand and fewer available trucks across dry van, refrigerated, and flatbed equipment.
The latest figures from the U.S. Energy Information Administration (EIA) and DAT Freight & Analytics present a mixed picture for trucking operations.
Fuel costs eased after two consecutive weekly increases, but diesel remains expensive, particularly in California and the western states. Meanwhile, freight postings increased and available truck postings declined, pushing load-to-truck ratios higher across all three major equipment categories.
The latest data point toward a tighter spot freight market, although a discrepancy in DAT's published rate comparisons makes the exact weekly movement in national linehaul rates uncertain.
Diesel Prices Decline Across Every Reported Region
According to EIA's November 3 release, the national average price for on-highway diesel fell to $6.292 per gallon, a decrease of 6.0 cents from the previous week's $6.352.
The decline follows two consecutive weeks of increases.
Every region and subregion tracked in EIA's weekly report recorded a lower average diesel price.
Regional Diesel Prices
United States: $6.292 per gallon | Down 6.0 cents
East Coast: $6.025 | Down 5.4 cents
New England: $6.416 | Down 0.5 cents
Central Atlantic: $6.486 | Down 1.0 cent
Lower Atlantic: $5.814 | Down 7.6 cents
Midwest: $6.402 | Down 7.8 cents
Gulf Coast: $5.912 | Down 3.9 cents
Rocky Mountain: $6.445 | Down 7.6 cents
West Coast: $7.272 | Down 5.7 cents
West Coast excluding California: $6.575 | Down 3.9 cents
California: $8.076 | Down 7.9 cents
Source: EIA Weekly On-Highway Diesel Prices. Reporting week November 2, 2026. Prices include taxes.
The Midwest recorded a 7.8-cent decline, while California fell 7.9 cents per gallon.
Despite the decline, California remained the most expensive area in the report at $8.076 per gallon.
The Gulf Coast continued to report the lowest average among EIA's major regions at $5.912.
The difference between California and the Gulf Coast exceeded $2.16 per gallon, illustrating how dramatically fuel expenses can vary depending on where a truck operates.
What the Diesel Decline Means for Trucking
A six-cent decline may not sound particularly significant when discussing a single gallon of fuel.
For commercial trucking operations, however, the difference becomes more meaningful as fuel consumption increases.
At the current national average of $6.292 per gallon:
A 150-gallon purchase costs approximately $943.80.
That same purchase would have cost $952.80 at the previous week's average.
The difference is $9 per 150 gallons.
An operation purchasing 1,000 gallons weekly would spend approximately $60 less at the new average, assuming its purchase prices follow the national trend.
These examples illustrate the effect of the weekly price movement rather than the actual savings of any particular carrier.
Individual fuel costs depend on location, negotiated discounts, fuel purchasing practices, and consumption.
The national average also remains 11.3 cents above its October 12 reading of $6.179.
In other words, this week's decline provides some relief, but it has not erased the increases recorded during the second half of October.
DAT Reports Tighter Freight Capacity Across All Three Equipment Types
DAT Freight & Analytics released its latest dry van, reefer, and flatbed market reports on November 2, covering the week ending October 31.
All three equipment categories experienced increased load postings and reduced truck postings.
That combination pushed load-to-truck ratios higher.
The load-to-truck ratio measures the number of posted loads relative to posted available trucks within DAT's marketplace.
A higher ratio generally indicates a tighter posted freight market, although it does not guarantee that every carrier or lane will experience higher rates.
Current National Spot Linehaul Rates
DAT reported the following national averages:
Dry van: $2.23 per mile
Reefer: $2.71 per mile
Flatbed: $2.61 per mile
These figures exclude fuel surcharges.
DAT's November 2 reports described weekly increases in all three categories. However, those reported changes do not reconcile with the national averages published in DAT's October 26 reports.
The earlier reports listed:
Dry van: $2.24 per mile
Reefer: $2.73 per mile
Flatbed: $2.63 per mile
The November 2 figures are therefore lower than the previously published figures, despite the newer reports describing increases.
Truck Stop Talk is reporting the current national rate figures as published by DAT without presenting the disputed weekly rate changes as established market movements.
The discrepancy does not affect the separately reported load-posting changes and load-to-truck ratios discussed below.
Dry Van: Load Demand Increases as Available Trucks Decline
Dry van freight showed a significant tightening in posted capacity during the latest reporting week.
According to DAT:
Load postings: Increased 8.4%
Truck postings: Declined 5.7%
Previous load-to-truck ratio: 9.51
Current load-to-truck ratio: 10.93
National spot linehaul average: $2.23 per mile, excluding fuel
The combination of more posted loads and fewer available trucks represents a meaningful improvement in the load-board balance from the previous week.
DAT also reported that dry van load postings were 26.8% higher than a year earlier, while available truck postings were 26.1% lower.
Those figures suggest that reduced posted capacity continues to play an important role in current freight market conditions.
However, the national average does not reflect every individual freight lane.
Rates can vary considerably depending on origin, destination, equipment requirements, and local freight availability.
Source: DAT November 2 Dry Van Market Report.
Reefer: Capacity Tightens Ahead of Holiday Freight Demand
The refrigerated freight market also recorded tighter conditions.
DAT reported:
Load postings: Increased 1.8%
Truck postings: Declined 4.3%
Previous load-to-truck ratio: 14.79
Current load-to-truck ratio: 15.73
National spot linehaul average: $2.71 per mile, excluding fuel
The higher ratio indicates more posted refrigerated freight relative to the available trucks listed on DAT's marketplace.
Seasonal freight demand remains an important consideration.
As Thanksgiving approaches, refrigerated transportation demand can shift with movements of produce, dairy products, meat, and other temperature-sensitive goods.
DAT's November 2 report also noted that produce transportation conditions vary significantly by growing region.
For refrigerated carriers, the national market numbers provide useful context, but individual lane conditions remain essential when evaluating available freight.
Source: DAT November 2 Reefer Market Report.
Flatbed: The Tightest Load-to-Truck Ratio
Flatbed recorded the most pronounced reduction in truck postings among the three major equipment categories.
DAT reported:
Load postings: Increased 7.4%
Truck postings: Declined 10.1%
Previous load-to-truck ratio: 34.93
Current load-to-truck ratio: 41.73
National spot linehaul average: $2.61 per mile, excluding fuel
The flatbed ratio remained substantially higher than those for dry van and reefer.
That does not mean flatbed automatically produces the highest revenue or profit.
Flatbed freight involves different equipment, operating costs, loading requirements, securement responsibilities, and market conditions.
Nevertheless, the increase in the load-to-truck ratio indicates that posted flatbed capacity became considerably tighter during the reporting week.
DAT also reported that flatbed load postings were stronger while available truck postings dropped by more than 10%.
That is one of the more notable freight-market developments in this week's report.
Source: DAT November 2 Flatbed Market Report.
What the Load-to-Truck Ratios Tell Us
All three major equipment categories recorded higher load-to-truck ratios compared with the previous reporting week.
Dry Van
Previous ratio: 9.51
Current ratio: 10.93
Reefer
Previous ratio: 14.79
Current ratio: 15.73
Flatbed
Previous ratio: 34.93
Current ratio: 41.73
All three categories moved toward tighter posted capacity.
The ratios measure activity on DAT's load board, not the total number of freight shipments or operating trucks across the United States.
They also should not be interpreted as a direct measurement of carrier profitability.
A stronger load-to-truck ratio can improve negotiating conditions in some markets, but actual revenue depends on the available freight, operating expenses, and negotiated rates.
Fuel Costs and Freight Conditions Are Moving Differently
This week's market reports highlight two developments occurring at the same time.
On one side, diesel prices declined across the country, reducing the average cost of purchasing fuel compared with the previous week.
On the other, DAT reported stronger posted freight demand relative to available capacity.
For carriers and owner-operators, those developments can influence operating conditions in different ways.
Lower diesel prices may reduce a portion of operating expenses, while tighter posted capacity can affect freight availability and negotiations.
But neither development guarantees stronger profit margins.
The actual financial result depends on the freight being hauled, the rate negotiated, fuel consumption, deadhead miles, equipment expenses, and other operating costs.
The distinction between linehaul rates and fuel-inclusive compensation is particularly important when comparing DAT's spot market figures with a carrier's actual settlement or operating revenue.
The Outlook for the Coming Weeks
The freight market is entering a period when seasonal shipping patterns can influence demand.
Retail replenishment, holiday distribution, refrigerated food shipments, and year-end industrial activity can create different conditions across equipment categories.
DAT's latest figures show tighter posted capacity entering November, but they do not establish that national freight rates will continue rising.
The current national linehaul averages and the unresolved week-over-week comparison discrepancy warrant caution when drawing conclusions about immediate rate direction.
For diesel, the next EIA release is scheduled for November 10.
Additional weekly DAT reports will help determine whether the latest tightening in posted freight capacity continues or reverses.
Sarge's Market Takeaway
This week's numbers offer some encouraging developments, but they need to be kept in perspective.
Diesel dropped six cents nationally, and every reported region saw a decline. That's welcome news when fuel remains one of the largest operating expenses in trucking.
At the same time, DAT's load-board data show more freight postings and fewer available trucks across dry van, reefer, and flatbed.
That's a tighter market than the previous week, at least in terms of posted freight and capacity.
What we cannot responsibly conclude from the published figures is that national spot linehaul rates increased across the board. DAT's latest reported rate changes conflict with the national averages in its preceding weekly reports.
The larger picture is that fuel expenses eased while posted freight capacity tightened, but the financial benefits for individual carriers will depend on their operating markets and costs.
That's where the numbers matter: not simply what the national averages say, but what those averages mean when a truck is actually running freight.
Official Data Sources
U.S. Energy Information Administration
Weekly On-Highway Diesel Prices
EIA Gasoline and Diesel Fuel Update
DAT Freight & Analytics | November 2, 2026
Dry Van Market Report
Reefer Market Report
Flatbed Market Report
DAT Trendlines
DAT Freight & Analytics | October 26, 2026
Previous Dry Van Report
Previous Reefer Report
Previous Flatbed Report